


VISUALIZING FOR
TRUST AND TRICKERY

How design choices shape belief, persuasion, and misinterpretation in data storytelling.

LATEST
STORIES

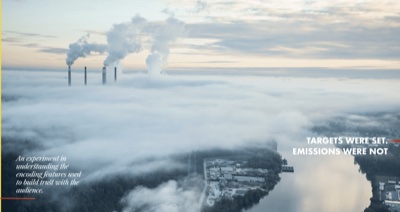
Aerial photo of power-plant smokestacks above fog

In collaboration with Timothy Zhang

Tableau logo

Data-driven visualizations built on tableau

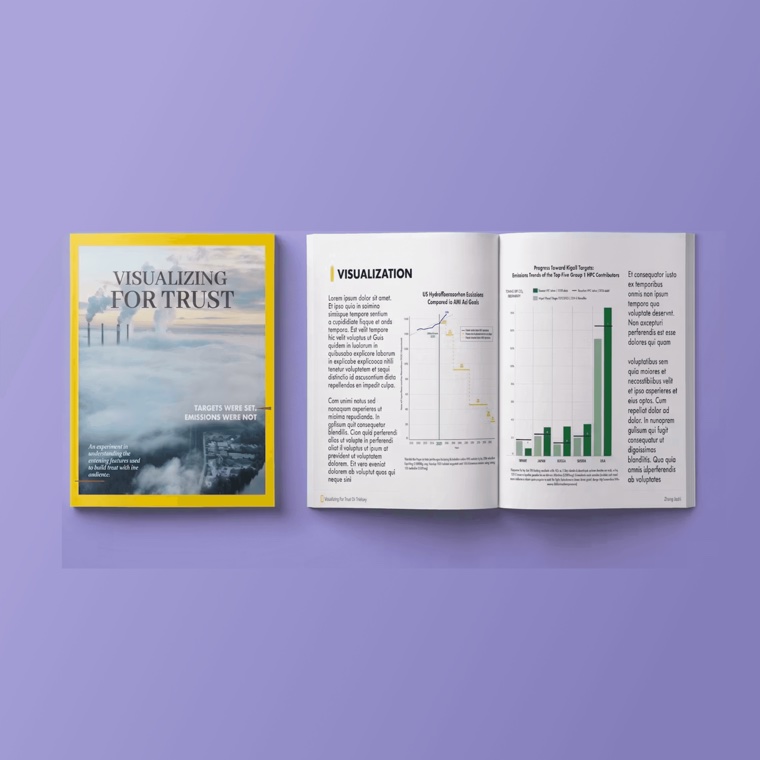
Visualizing for Trust magazine mock-up

NAT GEO MAGAZINE

Trust

CLICK

Visualizing for Trickery magazine mock-up

X SOCIAL MEDIA

Trickery

CLICK

BACK STORY

This project started with a simple, uncomfortable question: if the exact same dataset, with nothing fabricated or changed, can be shaped into two completely opposite conclusions, how do we know which one to believe? And what is it about a chart that makes it feel trustworthy in the first place?

For a course on Information Visualization, my partner and I took one dataset, OECD greenhouse gas emissions, and told two stories with it. The first, a story built for trust: a clean, editorial look at how the US and other nations are tracking against their Kigali Amendment and AIM Act commitments to phase down hydrofluorocarbons. The second, a story built for trickery: the same underlying data, re-encoded with truncated axes, cherry-picked framing, and quietly weaponized color, engineered to convince a skeptical audience that HFC regulation isn’t worth caring about.

Nothing in the deceptive version is fabricated. That’s what made building it so eye-opening, realizing just how easily we all fall prey to these forms of visualization deception, and exactly the point.

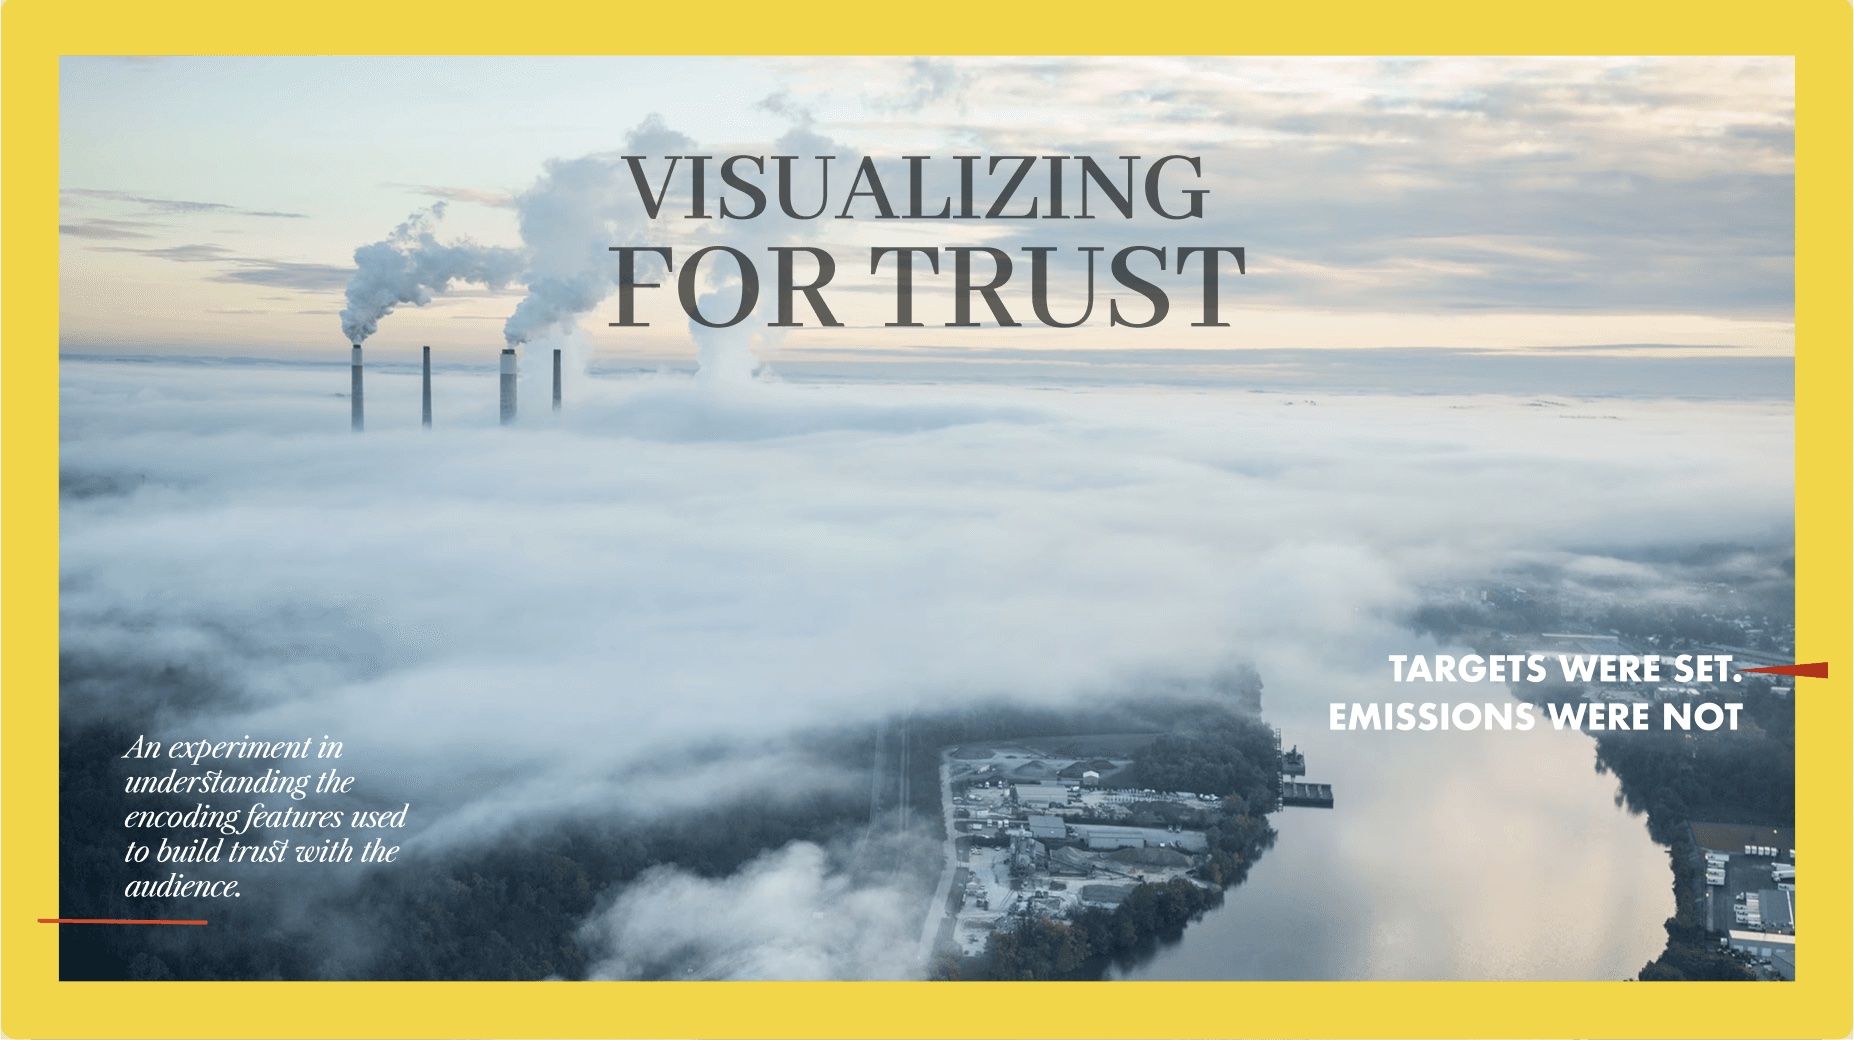
Magazine cover: Visualizing for Trust. Targets were set, emissions were not.

DATA STORY

The Kigali Amendment and the U.S. AIM Act represent two major efforts to reduce the use of hydrofluorocarbons (HFCs), a class of gases with extremely high global-warming potential. Together, they set the foundation for a coordinated, long-term reduction in HFC production and consumption.

SITUATIONAL CONTEXT

As countries enter the first major evaluation periods for the AIM Act and the Kigali Amendment, understanding who is meeting their reduction commitments—and who is falling behind helps reveal how effectively the world is responding to the climate impacts of HFCs.

AUDIENCE

People who seek clear, trustworthy explanations of climate policy and environmental trends but may not have technical expertise. They are the general reading public of a reputable science and nature magazine like the National Geographic.

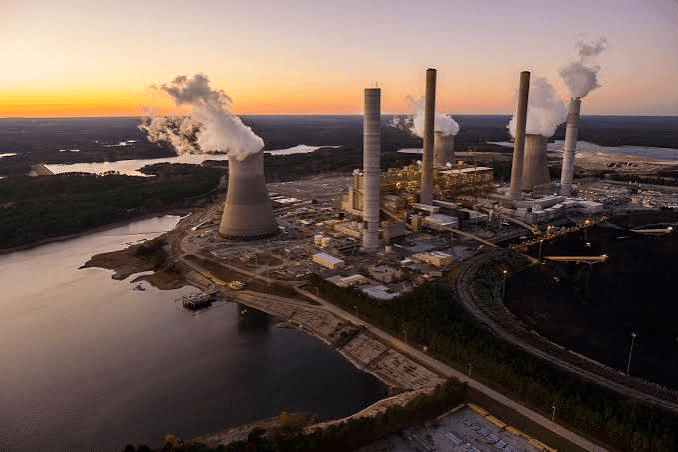
Power plant with cooling towers at sunset
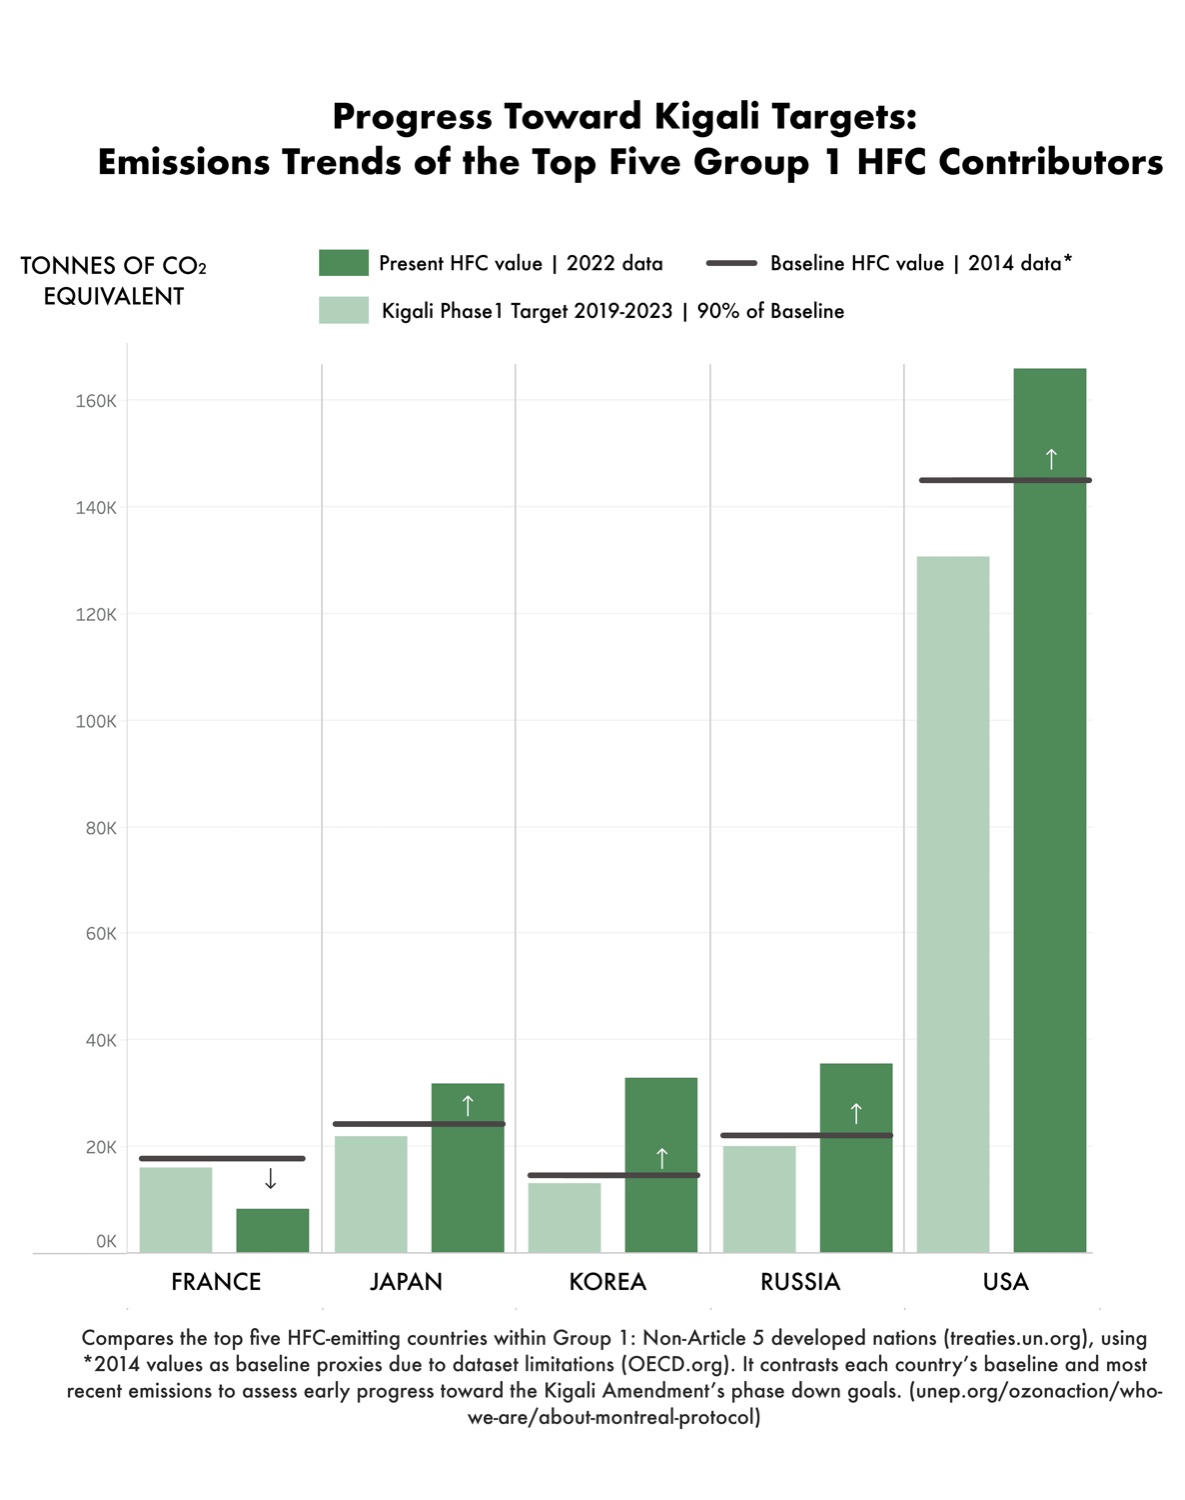
Bar chart: Progress toward Kigali targets, emissions trends of the top five Group 1 HFC contributors (France, Japan, Korea, Russia, USA)

Global Progress Under the Kigali Amendment

INTERNATIONAL

The Kigali Amendment aims to reduce global HFC emissions by 85% by 2036. We want to track the progress of the top 5 contributors to HFC emissions in the “Group 1:Non‑Article 5 developed countries” category of the Kigali Agreement over the first phase of the agreement.

Clearly labelled legend and axes in the same orientation as written content

Semantically consistent graphical markers for the data, eg. Baseline is a line marker

Hue marker to signify that the Present values and Kigali value bars represent similar data

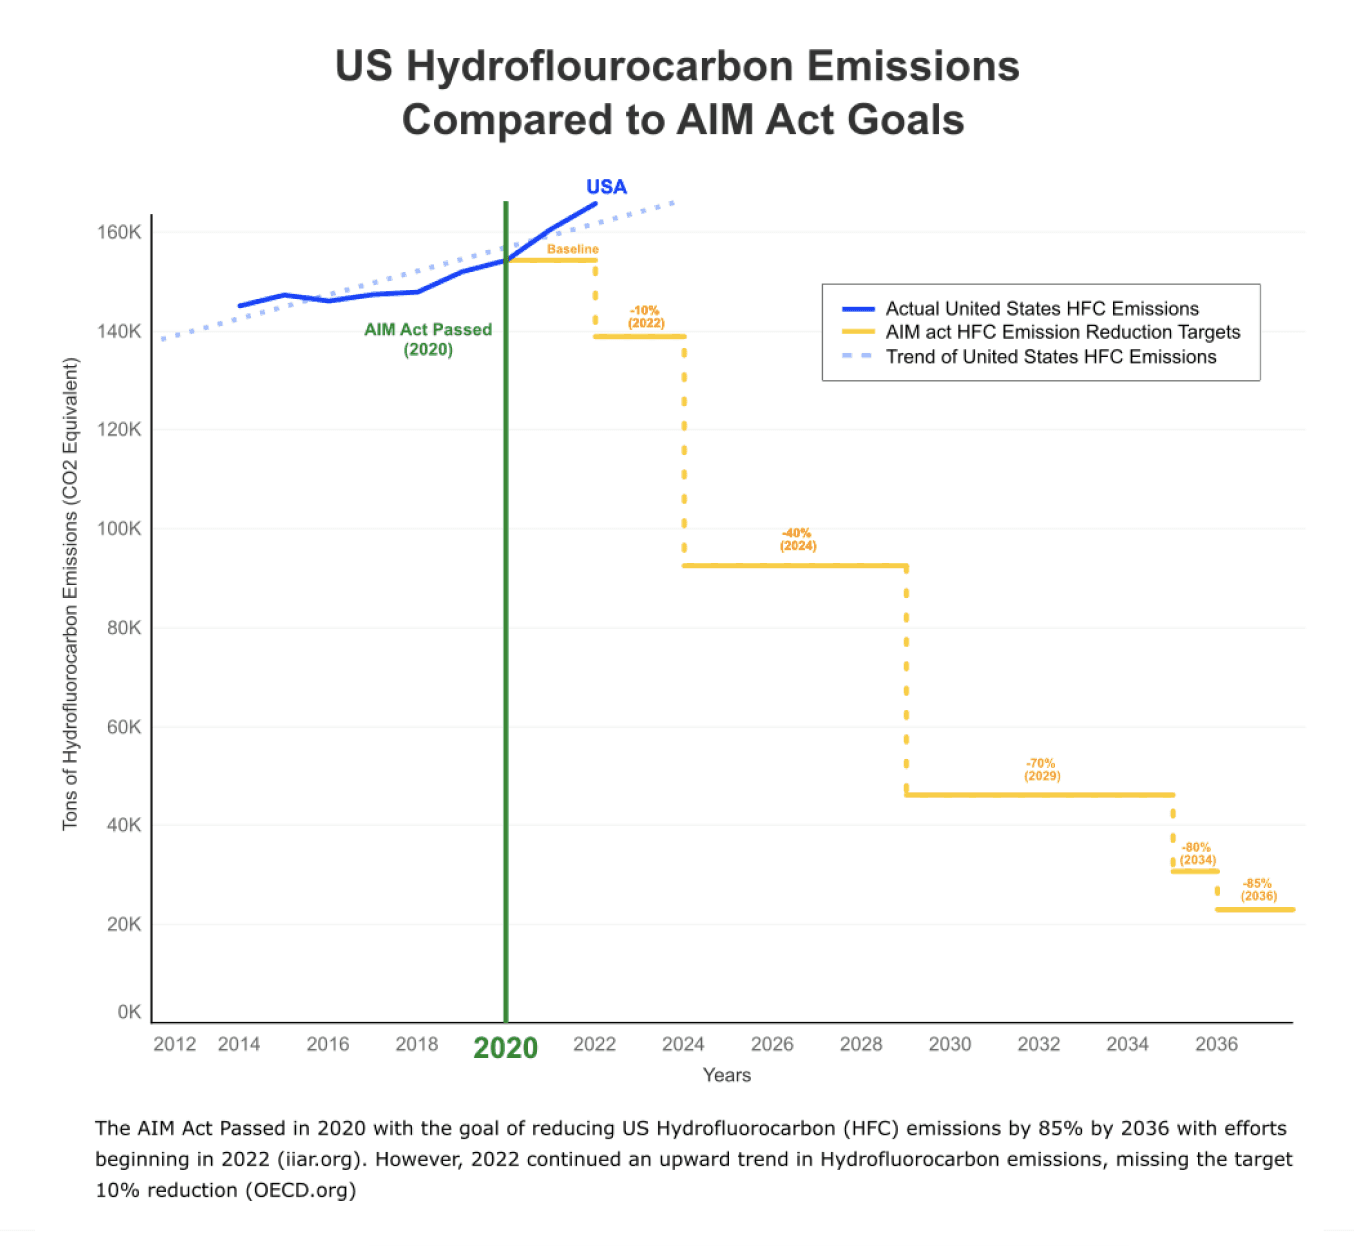
Line chart: US hydrofluorocarbon emissions compared to AIM Act goals, 2012 to 2036

U.S. Progress Under the AIM Act

DOMESTIC

Since the AIM Act took effect in 2020, EPA data show that the United States has steadily reduced regulated HFC production and consumption. We want to track the U.S.’ current progress towards this treaty.

Accurate axes with a true 0 value

Reference lines with annotations/labels to scaffold understanding

caption explaining visualization with sources for data

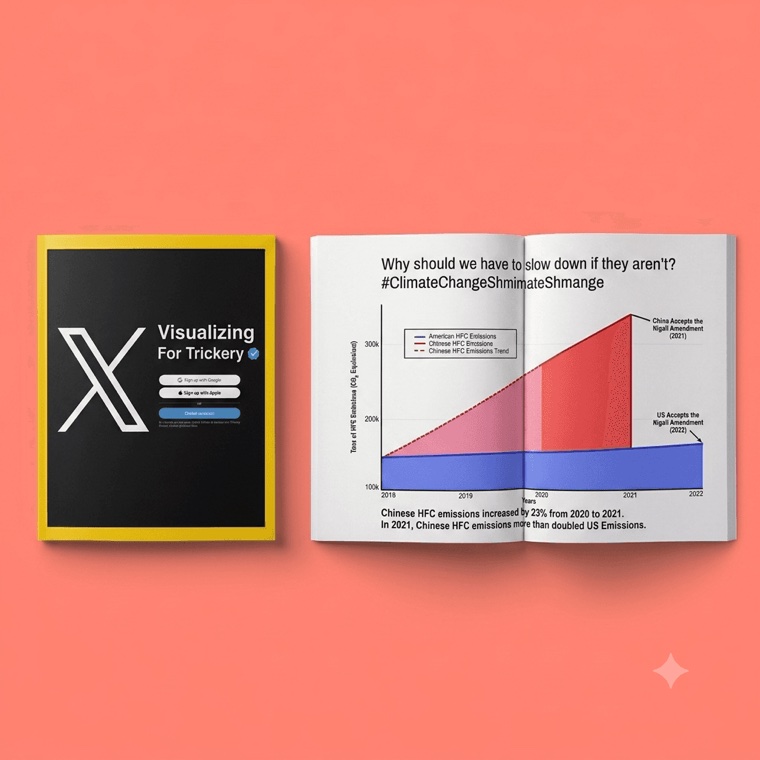
X-style sign-up screen titled Visualizing For Trickery

Data Story

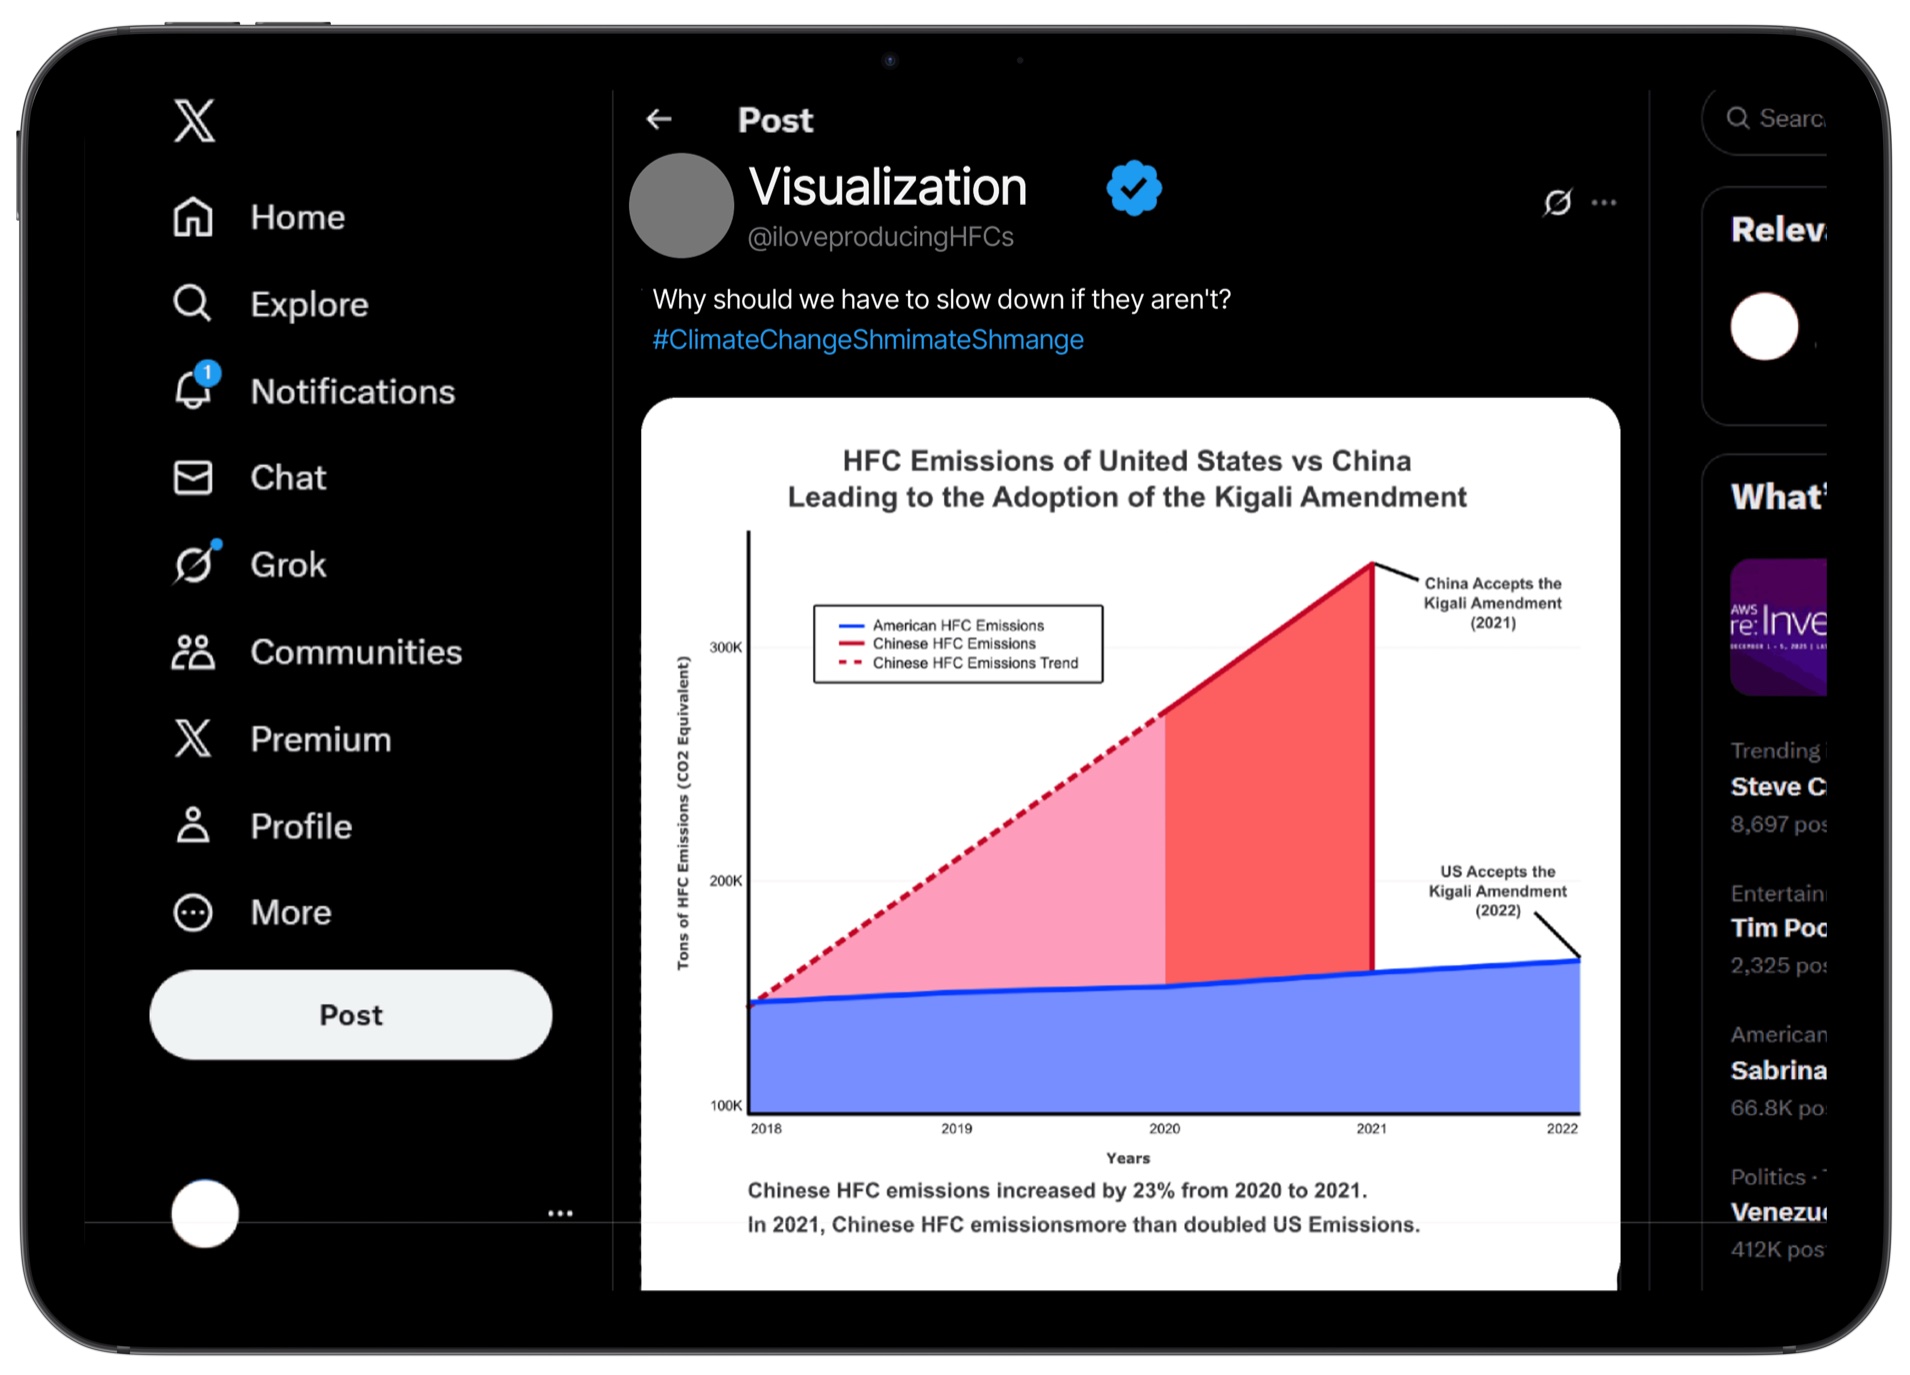
The United States and China are the top two largest contributors of Hydrofluorocarbon emissions, however China is producing much more pollution than the US. How much Hydrofluorocarbon emissions does the US produce in comparison to China? Should the US bear as much responsibility for reducing HFC emissions?

Audience and Situational Context

The US is a late adopter of the Kigali agreement. However, China, the largest contributor of HFC emissions, has already adopted the agreement. You are the constituency of an anti climate change legislator who believes that the US should not have to take responsibility for reducing emissions viewing the visualization from an X post

Tablet showing an X post: HFC emissions of United States vs China leading to the adoption of the Kigali Amendment

Emphasizing US vs China in title,
annotations, and color encodings
primes audience to feel adversarial

X-axis starts at 100k making the
US line seem lower than it is

Encoding magnitude as area makes the magnitude feel larger relative to height of points on a line

Limited axes ranges flattens curves. US upward trend much less apparent

Cherrypicked information in the caption

A special thanks to Professor Amy Rae Fox for a course that taught us to see semiotics and information visualization in everything :)

VISUALIZING FOR
TRUST AND TRICKERY

How design choices shape belief, persuasion, and misinterpretation in data storytelling.

LATEST
STORIES

Aerial photo of power-plant smokestacks above fog

In collaboration with Timothy Zhang

Tableau logo

Data-driven visualizations built on tableau

BACK STORY

This project started with a simple, uncomfortable question: if the exact same dataset, with nothing fabricated or changed, can be shaped into two completely opposite conclusions, how do we know which one to believe? And what is it about a chart that makes it feel trustworthy in the first place?

For a course on Information Visualization, my partner and I took one dataset, OECD greenhouse gas emissions, and told two stories with it. The first, a story built for trust: a clean, editorial look at how the US and other nations are tracking against their Kigali Amendment and AIM Act commitments to phase down hydrofluorocarbons. The second, a story built for trickery: the same underlying data, re-encoded with truncated axes, cherry-picked framing, and quietly weaponized color, engineered to convince a skeptical audience that HFC regulation isn’t worth caring about.

Nothing in the deceptive version is fabricated. That’s what made building it so eye-opening, realizing just how easily we all fall prey to these forms of visualization deception, and exactly the point.

Magazine cover: Visualizing for Trust. Targets were set, emissions were not.

DATA STORY

The Kigali Amendment and the U.S. AIM Act represent two major efforts to reduce the use of hydrofluorocarbons (HFCs), a class of gases with extremely high global-warming potential. Together, they set the foundation for a coordinated, long-term reduction in HFC production and consumption.

SITUATIONAL CONTEXT

As countries enter the first major evaluation periods for the AIM Act and the Kigali Amendment, understanding who is meeting their reduction commitments—and who is falling behind helps reveal how effectively the world is responding to the climate impacts of HFCs.

AUDIENCE

People who seek clear, trustworthy explanations of climate policy and environmental trends but may not have technical expertise. They are the general reading public of a reputable science and nature magazine like the National Geographic.

Power plant with cooling towers at sunset

Global Progress Under the Kigali Amendment

INTERNATIONAL

The Kigali Amendment aims to reduce global HFC emissions by 85% by 2036. We want to track the progress of the top 5 contributors to HFC emissions in the “Group 1:Non‑Article 5 developed countries” category of the Kigali Agreement over the first phase of the agreement.

Bar chart: Progress toward Kigali targets, emissions trends of the top five Group 1 HFC contributors (France, Japan, Korea, Russia, USA)

Clearly labelled legend and axes in the same orientation as written content

Semantically consistent graphical markers for the data, eg. Baseline is a line marker

Hue marker to signify that the Present values and Kigali value bars represent similar data

U.S. Progress Under the AIM Act

DOMESTIC

Since the AIM Act took effect in 2020, EPA data show that the United States has steadily reduced regulated HFC production and consumption. We want to track the U.S.’ current progress towards this treaty.

Line chart: US hydrofluorocarbon emissions compared to AIM Act goals, 2012 to 2036

Accurate axes with a true 0 value

Reference lines with annotations/labels to scaffold understanding

caption explaining visualization with sources for data

X-style sign-up screen titled Visualizing For Trickery

Data Story

The United States and China are the top two largest contributors of Hydrofluorocarbon emissions, however China is producing much more pollution than the US. How much Hydrofluorocarbon emissions does the US produce in comparison to China? Should the US bear as much responsibility for reducing HFC emissions?

Audience and Situational Context

The US is a late adopter of the Kigali agreement. However, China, the largest contributor of HFC emissions, has already adopted the agreement. You are the constituency of an anti climate change legislator who believes that the US should not have to take responsibility for reducing emissions viewing the visualization from an X post

Tablet showing an X post: HFC emissions of United States vs China leading to the adoption of the Kigali Amendment

Emphasizing US vs China in title, annotations, and color encodings primes audience to feel adversarial

Encoding magnitude as area makes the magnitude feel larger relative to height of points on a line

X-axis starts at 100k making the US line seem lower than it is

Limited axes ranges flattens curves. US upward trend much less apparent

Cherrypicked information in the caption

A special thanks to Professor Amy Rae Fox for a course that taught us to see semiotics and information visualization in everything :)

VISUALIZING FOR
TRUST AND
TRICKERY

How design choices shape belief, persuasion, and misinterpretation in data storytelling.

LATEST
STORIES

Visualizing for Trust magazine mock-up

NAT GEO MAGAZINE

Trust

CLICK

Visualizing for Trickery magazine mock-up

X SOCIAL MEDIA

Trickery

CLICK

Aerial photo of power-plant smokestacks above fog

In collaboration with Timothy Zhang

Tableau logo

Data-driven visualizations built on tableau

BACK STORY

This project started with a simple, uncomfortable question: if the exact same dataset, with nothing fabricated or changed, can be shaped into two completely opposite conclusions, how do we know which one to believe? And what is it about a chart that makes it feel trustworthy in the first place?

For a course on Information Visualization, my partner and I took one dataset, OECD greenhouse gas emissions, and told two stories with it. The first, a story built for trust: a clean, editorial look at how the US and other nations are tracking against their Kigali Amendment and AIM Act commitments to phase down hydrofluorocarbons. The second, a story built for trickery: the same underlying data, re-encoded with truncated axes, cherry-picked framing, and quietly weaponized color, engineered to convince a skeptical audience that HFC regulation isn’t worth caring about.

Nothing in the deceptive version is fabricated. That’s what made building it so eye-opening, realizing just how easily we all fall prey to these forms of visualization deception, and exactly the point.

Magazine cover: Visualizing for Trust. Targets were set, emissions were not.

DATA STORY

The Kigali Amendment and the U.S. AIM Act represent two major efforts to reduce the use of hydrofluorocarbons (HFCs), a class of gases with extremely high global-warming potential. Together, they set the foundation for a coordinated, long-term reduction in HFC production and consumption.

SITUATIONAL CONTEXT

As countries enter the first major evaluation periods for the AIM Act and the Kigali Amendment, understanding who is meeting their reduction commitments—and who is falling behind helps reveal how effectively the world is responding to the climate impacts of HFCs.

AUDIENCE

People who seek clear, trustworthy explanations of climate policy and environmental trends but may not have technical expertise. They are the general reading public of a reputable science and nature magazine like the National Geographic.

Power plant with cooling towers at sunset

Global Progress Under the Kigali Amendment

INTERNATIONAL

The Kigali Amendment aims to reduce global HFC emissions by 85% by 2036. We want to track the progress of the top 5 contributors to HFC emissions in the “Group 1:Non‑Article 5 developed countries” category of the Kigali Agreement over the first phase of the agreement.

Bar chart: Progress toward Kigali targets, emissions trends of the top five Group 1 HFC contributors (France, Japan, Korea, Russia, USA)

Clearly labelled legend and axes in the same orientation as written content

Hue marker to signify that the Present values and Kigali value bars represent similar data

Semantically consistent graphical markers for the data, eg. Baseline is a line marker

U.S. Progress Under the AIM Act

DOMESTIC

Since the AIM Act took effect in 2020, EPA data show that the United States has steadily reduced regulated HFC production and consumption. We want to track the U.S.’ current progress towards this treaty.

Line chart: US hydrofluorocarbon emissions compared to AIM Act goals, 2012 to 2036

Reference lines with labels to scaffold understanding

Accurate axes with a true 0 value

caption explaining visualization
with sources for data

X-style sign-up screen titled Visualizing For Trickery

Data Story

The United States and China are the top two largest contributors of Hydrofluorocarbon emissions, however China is producing much more pollution than the US. How much Hydrofluorocarbon emissions does the US produce in comparison to China? Should the US bear as much responsibility for reducing HFC emissions?

Audience and Situational Context

The US is a late adopter of the Kigali agreement. However, China, the largest contributor of HFC emissions, has already adopted the agreement. You are the constituency of an anti climate change legislator who believes that the US should not have to take responsibility for reducing emissions viewing the visualization from an X post

Tablet showing an X post: HFC emissions of United States vs China leading to the adoption of the Kigali Amendment

Emphasizing US vs China in title, annotations, and color encodings primes audience to feel adversarial

X-axis starts at 100k making the US line seem lower than it is

Encoding magnitude as area makes the magnitude feel larger relative to height of points on a line

Limited axes ranges flattens curves. US upward trend much less apparent

Cherrypicked information in the caption

A special thanks to Professor Amy Rae Fox for a course that taught us to see semiotics and information visualization in everything :)